To learn more about how you can use the capacity report to gain real-time visibility of scheduled hours versus demand for a specific location over a week, please check out the following guides;
When you are viewing a capacity report for a given location and time period, the following data is displayed;
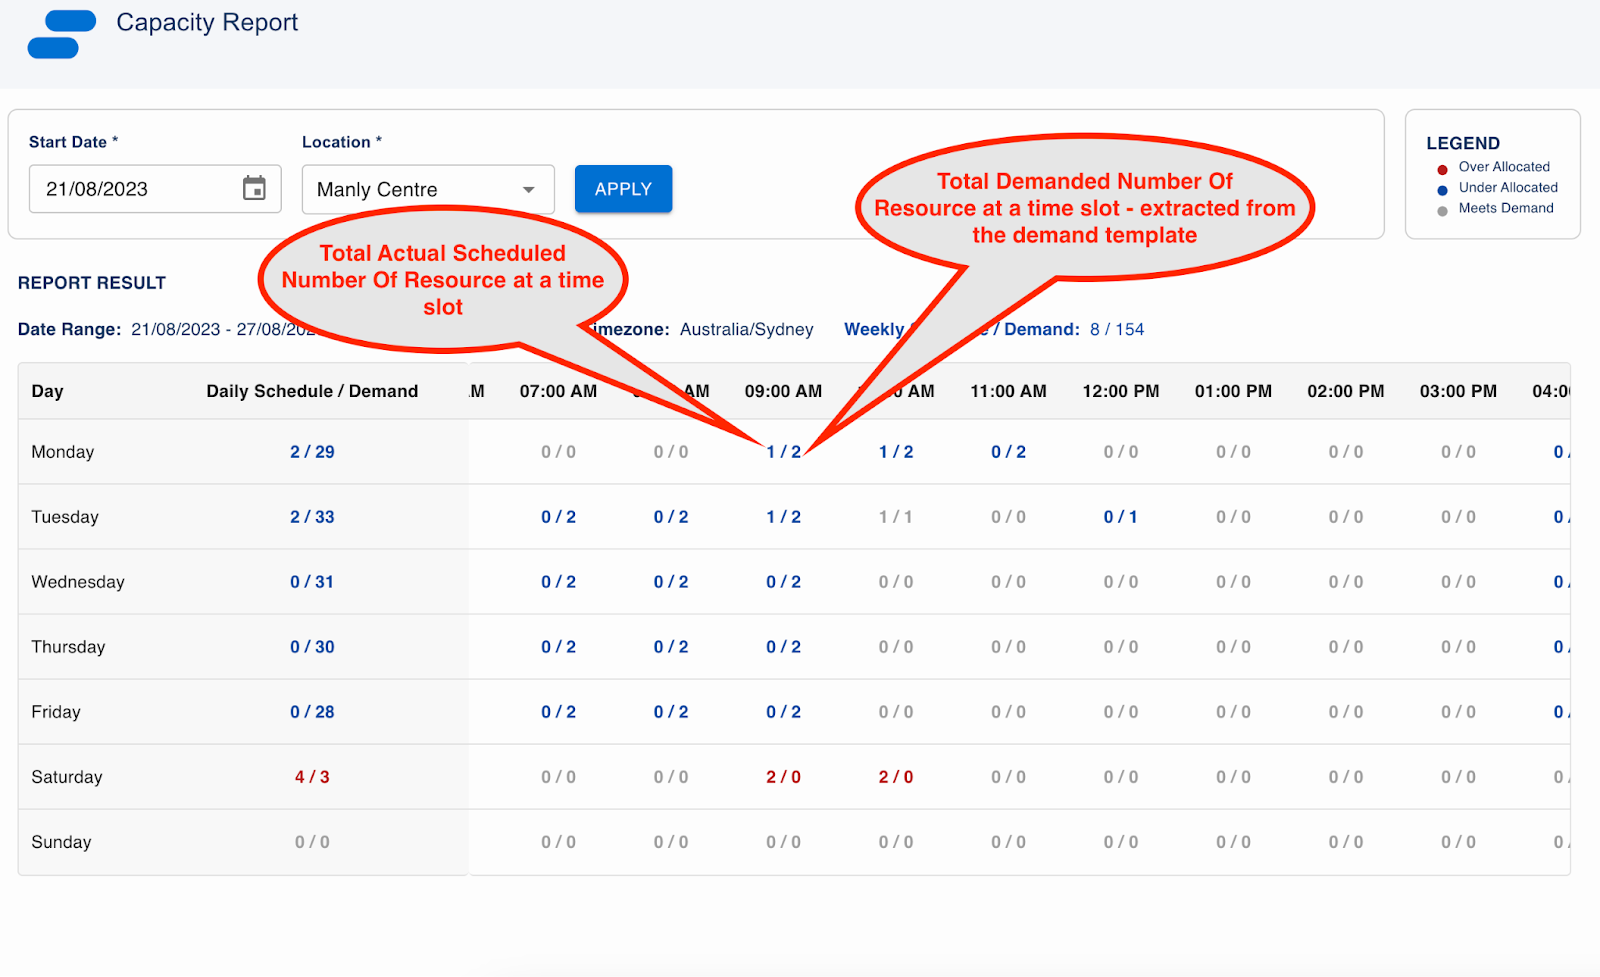
- Date Range – one week from selected Start Date
- Location – display filtered location
- Timezone – extracted from the region of the location. In the case where the timezone of the region cannot be extracted, the timezone of the logged in user will be used alternatively. Which timezone is being used will be precisely communicated on the UI.
- Weekly Schedule/Demand – total actual scheduled number of resources for the week / total demanded number of resources for the week.
- Day – This represents a one-week period, starting on Monday and ending on Sunday.
- Daily Schedule/Demand – total actual scheduled number of resources for the day / total demanded number of resources for the day.
- Time period/increment – This represents the time of the day in a 12-hour clock format.
- At each time slot level – The figures are presented in the following format:
- On the right: the demanded number of resources.
- On the left: the actual scheduled number of resources.
- Two (2) figures are separated by a forward slash ( / )
- The comparisons are reported on a time slot, daily and weekly level.
- The actual scheduled Number of Resources is calculated following the below logics:
- On a time slot level, it is the count of job allocations that:
- are not in “deleted” or “pending allocation” or “declined” statuses and
- are associated to the jobs within the selected location
- the job allocation’s start time is less than the time slot’s end time and
- the job allocation’s end time is greater than the time slot’s start time
- On a daily level, it is the total/sum of all time slots of the day.
- On a weekly level, it is the total/sum of all days of the week.
- On a time slot level, it is the count of job allocations that:
- Report highlight legend/rules:
- When the actual schedule is greater than the demand (over-allocated), the pair of figures will be highlighted in red.
- When the actual schedule is less than the demand (under-allocated), the pair of figures will be highlighted in blue.
- When the actual schedule is equal to the demand (meets demand), the pair of figures stays as is (not highlighted by any colour codes).